Panorama (RAM zoom) functionality
The SmartScope comes with 64Mbit of RAM, which by default is used to provide a 4M (4e6) sample buffer for each channel. In general, this means that whenever you stop an acquisition, you can zoom in about 1000 times on the waves currently displayed. This can be very useful in case you want to trigger on an event, and study in fine detail all causing and resulting effects which happened before or after that event.
User Graphical Interface elements
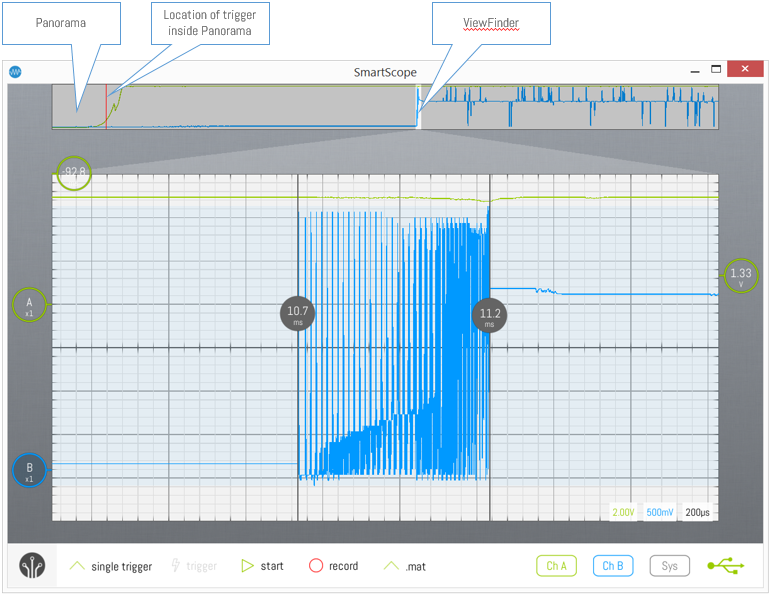
An example screenshot is presented below, after which the main elements will be described below.

The Panorama
The Panorama is the bar shown at the top of the screen. It displays the entire contents of the RAM memory.
The ViewFinder
The ViewFinder is the area of the Panorama corresponding to the area currently displayed on the main screen. It is highlighted on the Panorama, to give a clear visual indication of which section of the Panorama you’re currently inspecting on the main screen. This is further enhanced by the highlights underneath the Panorama, visually linking the area of the main graph to the ViewFinder.
The ViewFinder can be moved across the Panorama by swiping it, or by dragging it by mouse.
The Trigger
The position of the trigger is also shown in the Panorama. In case the trigger is outside the timespan of the main graph, this gives a quick indication of where the trigger is relative to the signal visualized in the main graph.
Using the Panorama and ViewFinder
The following table can be used as quick reference:
| Touch | Mouse | Keyboard | |
|---|---|---|---|
| Zoom in on wave = Reduce ViewFinder |
Pinch ViewFinder | I | |
| Zoom out on wave = Enlarge ViewFinder |
Pinch ViewFinder | O | |
| Pan ViewFinder | Drag ViewFinder | Drag ViewFinder | Ctrl+Left/Right |
| Show the Panorama | Double-tap top border | Double-click top border | P |
| Hide the Panorama | Double-tap Panorama | Double-click Panorama | P |
Help! I’m getting terribly slow refresh rates
In certain configurations, using the Panorama might result in undesirably slow update rates.
Let’s apply some math on the screenshot at the top of this page. The main graph is set to 200us/div, resulting in 1,2ms shown on the total screen, so you could expect up to 800 updates per second. However, notice that the full Panorama is much larger than the currently set ViewFinder: about 1%. This means that it takes 120ms to fill a new Panorama with samples! As such, the maximum refresh rate of the screen will be 8Hz.
In case this is undesired, either:
- Enlarge the ViewFinder using ‘O’ and afterwards Zoom in on the global timescale using ‘PageUp’
- Hide the Panorama using ‘P’
Under the hood
The Panorama will never hide itself. In case you don’t use the Panorama, you can hide it by pressing ‘P’. When hiding the Panorama, the buffersize is minimized to correspond to the main graph, making sure the maximum data refresh rate is achieved.
For the same reason, whenever the SmartScope app is closed and re-opened, the size of the Panorama will be reset to maximize the refresh rate.
Whenever the SmartScope is stopped, the Panorama will automatically open, inviting you to browse the samples stored inside the RAM memory.
Acquisition speed and buffer size details
By opening up the System measurement box at the bottom-right of the screen, you can find 4 parameters controlled by the Panorama and ViewFinder configuration:
- Acquisition: shows the timespan of data stored inside the RAM
- VF Length: shows the timespan represented by the ViewFinder
- VF Offset: shows the time offset of the ViewFinder, relative to the first sample of the Panorama
- Sample rate: the rate at which analog voltages are acquired and stored inside the RAM. In case the Panorama size is set larger than 4e6 samples, the sample rate will automatically be downscaled to the optimal speed.