Logic Analyzer functionality
Next to its dual-channel oscilloscope front-end, the SmartScope includes a powerful Logic Analyzer. 8 input pins on the back of the SmartScope allow you to sample a digital signals simultaneously at 100MS/s.
This section describes how to operate the SmartScope software to effectively use the Logic Analyzer functionality.

Logic Analyzer - Hardware specifications
- Supported digital voltage levels:
- 3.3V, 5.0V: Up to 50MHz digital signals
- 2.5V: Up to 40Mhz digital signals
- 1.8V: Up to 10Mhz digital signals
- Maximum voltage range: [-0.5V, 5.5V]
- Applying voltages beyond this range can permanently damage the input channel!
- Spikes/Transients outside this range are OK, as we have hi-speed bidirectional TVS diodes on each input
See the Connectors pinout article to find out which pins are reserved for the Logic Analyzer.
Selecting the Logic Analyzer mode
Simply open up the main menu, and select ‘’Digital mode’’ to bring up the Logic Analyzer Graph. Note that the full Analog Graph functionality is also available in ‘’Mixed mode’’
File:SelectLA.png
Logic Analyzer main screen
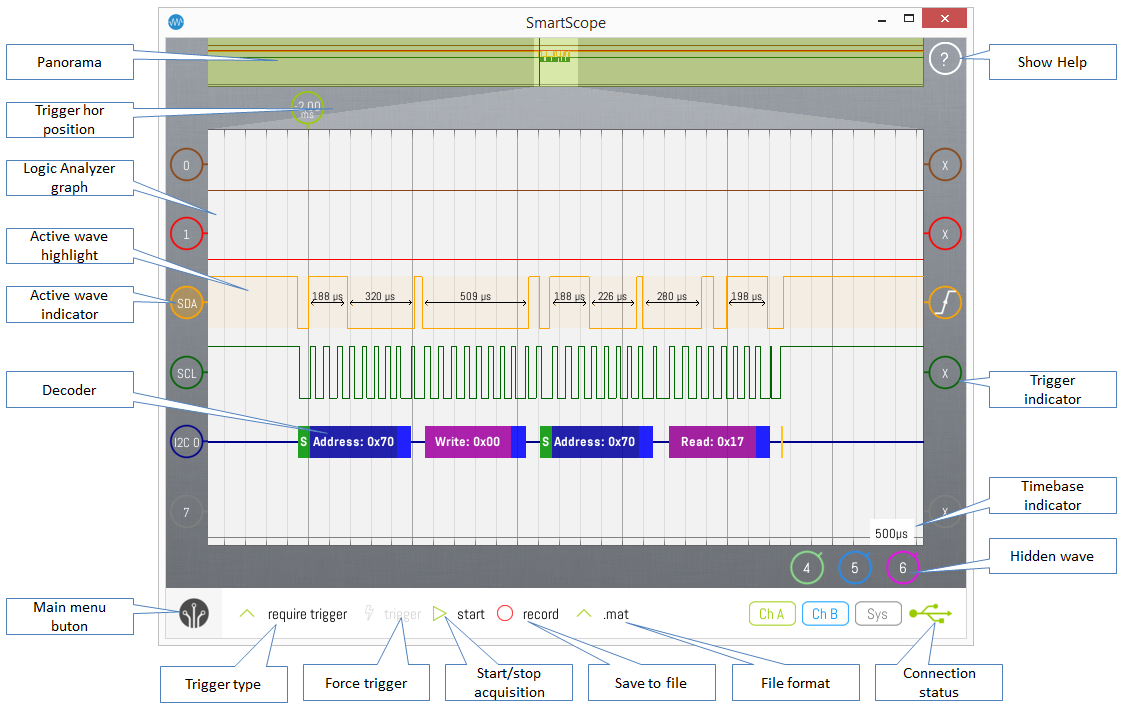
The key parts of the Logic Analyzer screen are shown on the image below. This image can be used as reference for the rest of this text.
Some elements are the topic of other articles:
Visualizing your digital signals
First you’ll want to make sure you have optimal visibility on your digital wave. Since you’re probably using the LA for visualizing digital communication, you’ll want to
- Move the trigger position (pan) so the start of the communication is shown on the graph
- Change the timescale so the key part of the communication is fitting inside the graph
These actions are described below in more detail.
Changing the trigger position (panning)
You’ll also want to position your waves to your liking. Here are the operations to achieve this:
| Touch | Mouse | Keyboard |
|---|---|---|
| Drag | Left-drag | Arrow keys |
Using touch/mouse, you can drag your waves or the horizontal trigger indicator. Dragging the indicator has the benefit that it auto-snaps to the grid divisions.
Dragging will also occur when, while pinching, you move both fingers in the same direction.
Timebase scaling
Depending on whether you want to visualize a fast signal or a slow signal, you’ll want to set the timebase accordingly. This can be achieved using the following operations:
| Touch | Mouse | Keyboard |
|---|---|---|
| Horizontal Pinch | Mousewheel or right-drag | Home or End |
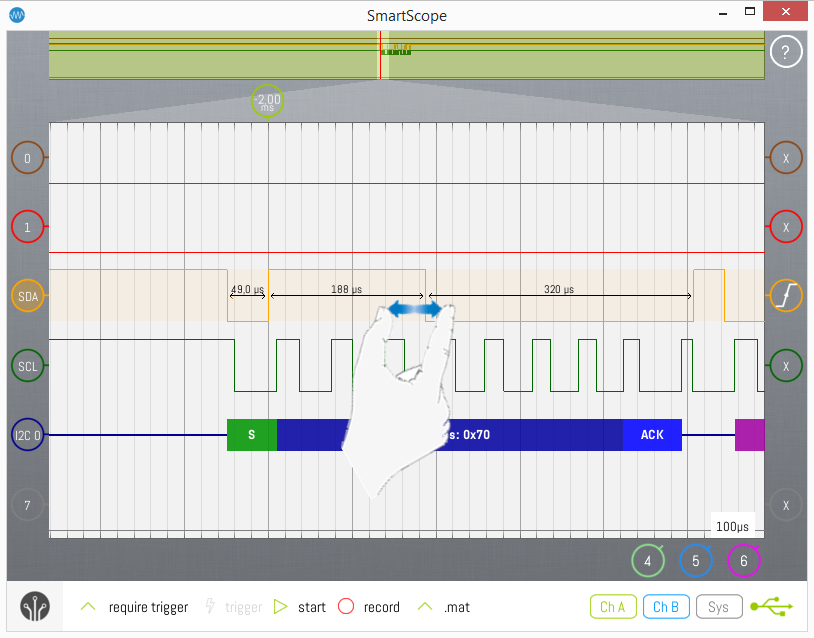
Zooming by mouse or keyboard will switch between predefined values. By pinching you can continuously zoom in or out to an arbitrary value.
The image below shows how timebase zooming on can be done:

The grid can help you determine the timebase of your signal as well. The grid is split in 10 horizontal divisions, and the timespan of each division is displayed in the Timebase indicators, on the bottom-right of the screen.
Repositioning/Hiding/Showing signals
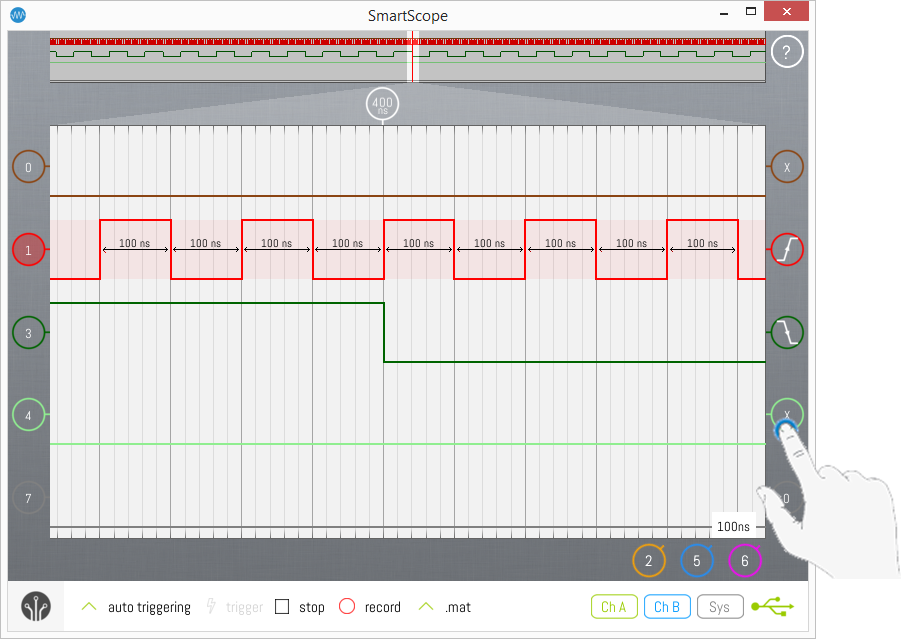
In some cases where you don’t need 8 digital inputs, you might want to reposition or even hide some of them as they can clutter the screen. Repositioning is pretty straightforward: simply drag any digital wave or its indicator to wherever you desire. When you release the wave, all waves will auto-snap to their optimal position. You can also hide inactive digital waves, which will free up graph space for other signals. This is especially useful in Mixed mode, where the graph area can be small. When you hide a digital wave, the remaining signals will be enlarged. To hide a digital wave, tap its indicator as shown below, and select hide. The wave will be hidden, and its indicator will be moved to the bottom-right corner. To re-activate a hidden wave, simply tap its indicator residing at the bottom-right corner.
Time interval arrows / Active wave
The Logic Analyzer contains a feature which indicates the time between various rising or falling edges. This is only shown for the currently selected Active wave (see below) and for the wave underneath the mouse pointer. In order to select another wave as Active wave, simply tap/click that wave. Use (shift+)Tab to Activate the (previous)next wave. You can recognize the currently selected Active wave as follows:
- Its background is slightly highlighted
- Its 0-level indicator has a darker color
- Time interval arrows are shown between its rising and falling edges
Time interval arrows are only shown in case there is enough space. As an example, no arrows will be shown for a high-frequency clock when you’re not sufficiently zoomed in on the time-axis.
Triggering
The Logic Analyzer allows you to trigger on any combination of states/events of the 8 digital inputs. These include:
- Don’t care (X)
- Rising (R)/falling (F) edge
- Low (0) / High (1)
For example, in the screen below the SmartScope is instructed to trigger at any event where:
- D1 encounters a Rising edge
- D3 encounters a Falling edge
- D7 stays Low

In order to change the trigger condition, simply tap the trigger indicators (also shown in the image above) until you reach the condition you require.
Trigger modes
The following trigger modes are available:
Auto mode
In Auto mode, every time a trigger is detected, the waveform is acquired, transferred to the host and visualized. Whenever the trigger is lost (eg: when the input signal is removed, or when the signal changes so no more crossings with the trigger level occur), the SmartScope sends any acquired waveform to the host for visualization
Normal mode (=required trigger)
In Normal mode, every time a trigger is detected, the waveform is acquired, transferred to the host and visualized, much like Auto mode. However, in case no trigger is detected, no new data is transferred nor visualized, keeping the last triggered waveform on the screen.
Single mode
Single mode puts the SmartScope in waiting mode until a trigger is detected. In such case, the waveform is acquired and visualized, after which the SmartScope puts itself in Stopped mode. Single mode is useful in case you want to visualize the very first occurrence of a trigger, or in case you want to capture a unique event and don’t want to remove the result in case of some glitch occurs when you remove the probe.
Rolling mode
When you’re visualizing slow signals, you end up with timebase settings like 100ms/div. With 10 divisions, this means it takes 1 seconds before an acquitisition can be made, so you only get screen refreshes every second. In such case, it is usually preferred to visualize the data as a continuously incoming stream of data, as you get realtime updates of the signal and you can stop the SmartScope whenever you want.
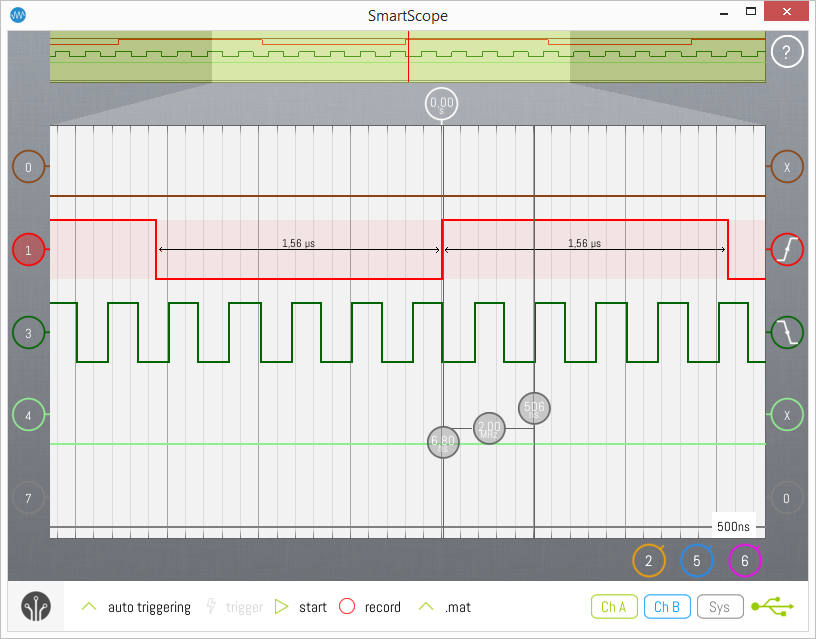
Cursors
See the main page on Cursors to find out all details about them. Only vertical cursos are supported on the Logic Analyzer graph.

