FFT
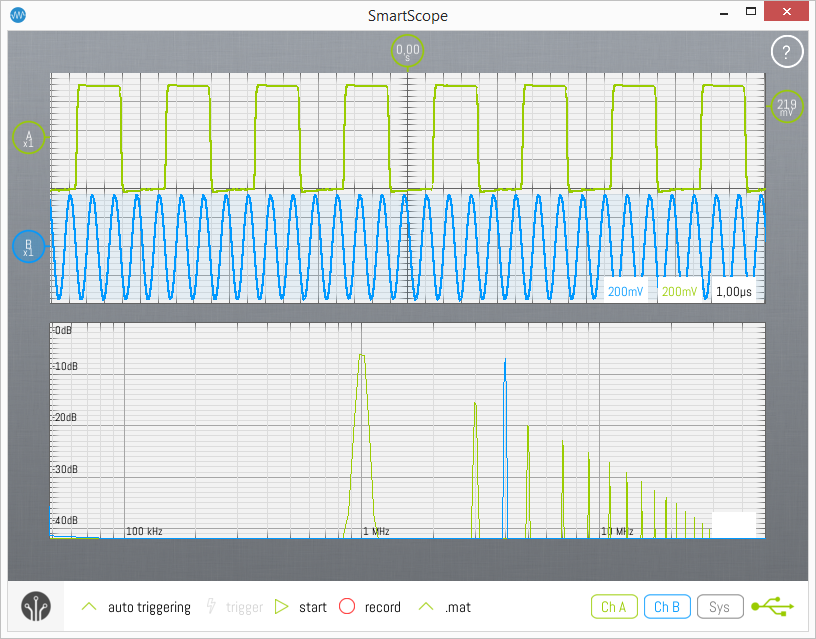
The SmartScope software comes with an integrated spectrum analyzer up to 50MHz.
Enabling FFT
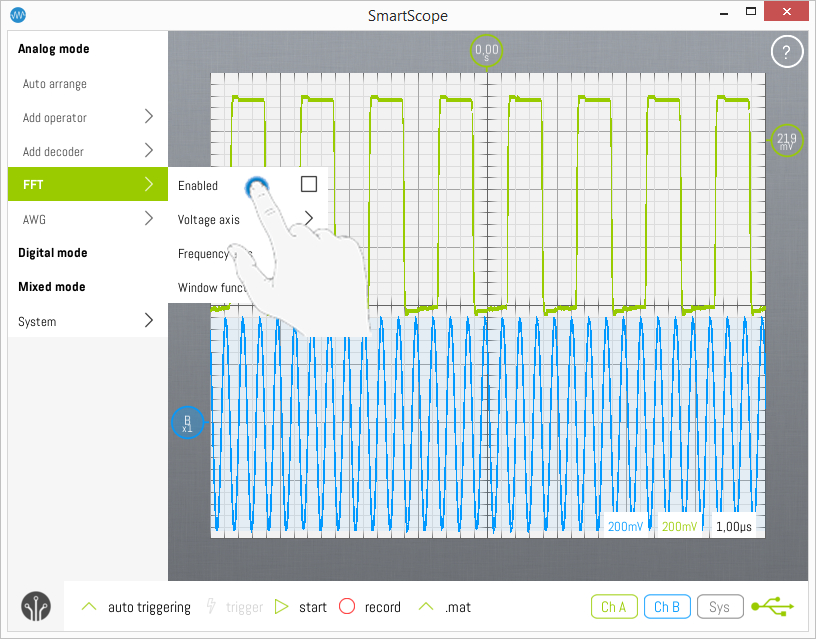
Since FFT is done on the Analog input, first make sure you're in Analog mode after which you can enable the FFT graph by opening the Main menu -> Analog mode -> FFT -> Enable, as shown in the image below.
Difference between Real-Time and Fine mode
Whenever FFT is enabled and the acquisition is running, a coarse FFT with 2048 bins will be calculated and shown in real-time. In case you want a more accurate FFT, stop the acquisition after which a more fine-grained result (up to 500.000 bins) will be calculated and shown.
Selecting Linear/Logarithmic axes
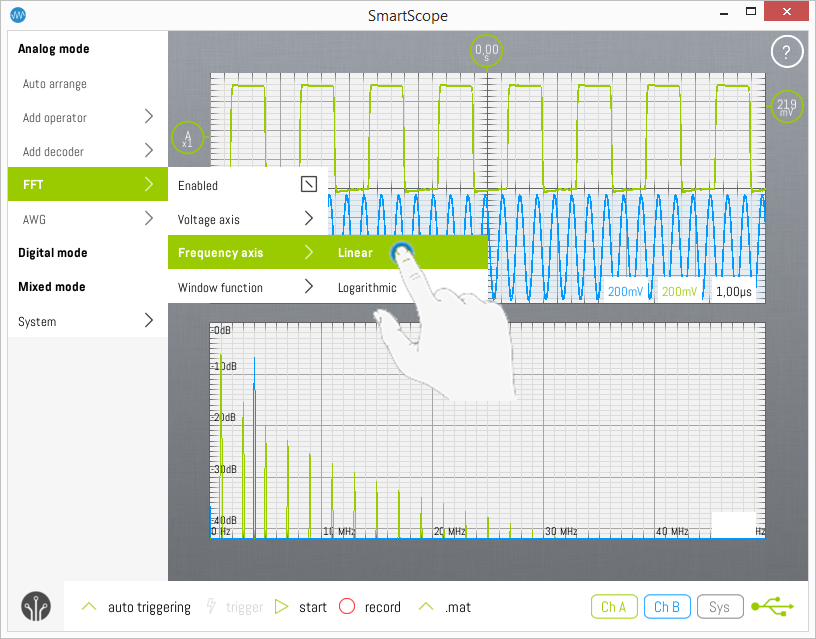
Especially when working with frequenties, it is often desirable to use logarithmic axes. The SmartScope software allows you to select either linear or logarithmic axes for both the Voltage and Frequency axes individually. The scale of an axis can be changed by going to the Main menu -> Analog mode -> FFT -> [Axis of your choice] -> [Scale of your choice], as shown in the image below:
Selecting windowing function
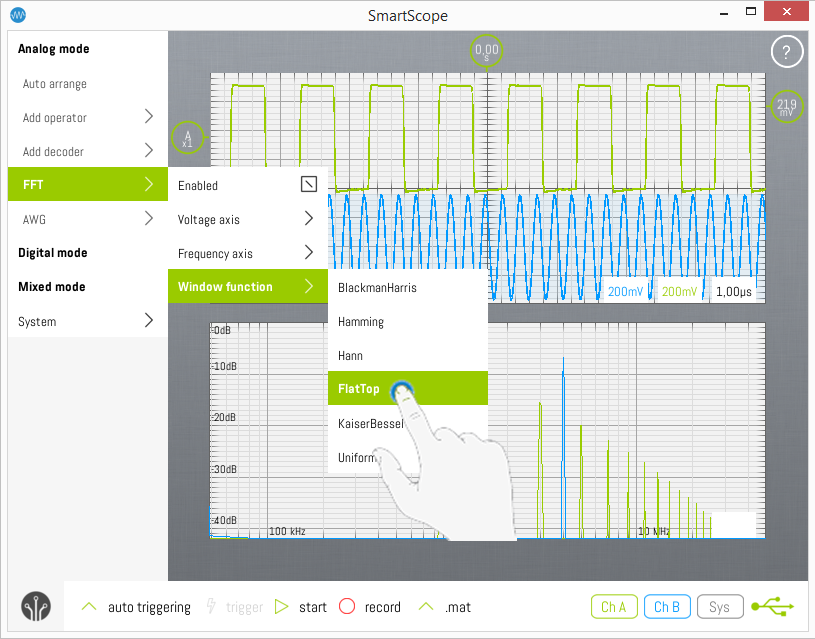
In order to reduce spectral leakage, it is recommended to apply a Windowing function to your signal before taking the FFT. The windowing function can be selected by going to Main menu -> Analog mode -> FFT -> Window function -> [Window of your choice]. Select Uniform to turn off windowing.
Changing size of graphs
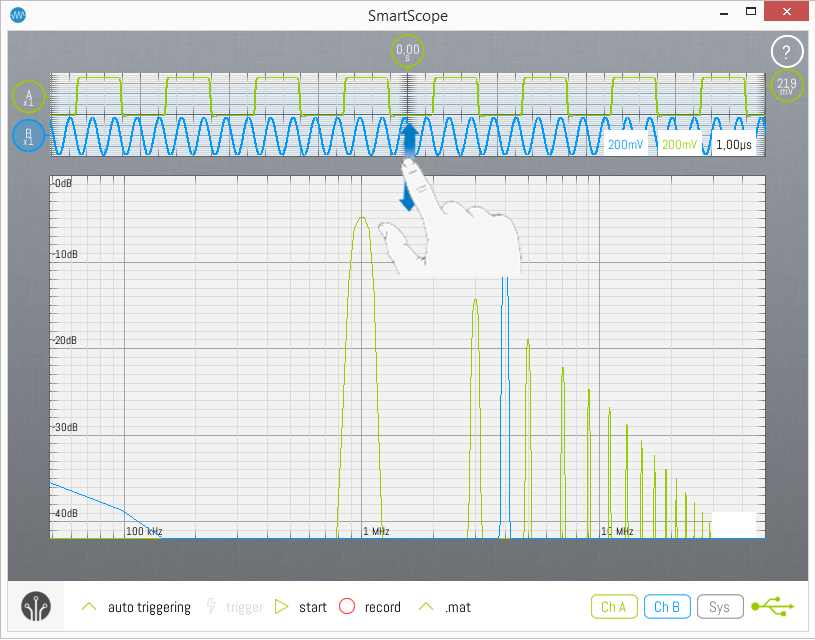
In case you want to enlarge the size of either graph, simply drag the area between both graphs up or down as shown in the image below:
