XY Mode
Revision as of 16:03, 16 November 2016 by Riemerg (talk | contribs) (Created page with "The SmartScope app comes with XY functionality, plotting Channel A versus Channel B (or vice versa) <br>File:XY.png =Enabling XY mode= To enable XY mode, open the main men...")
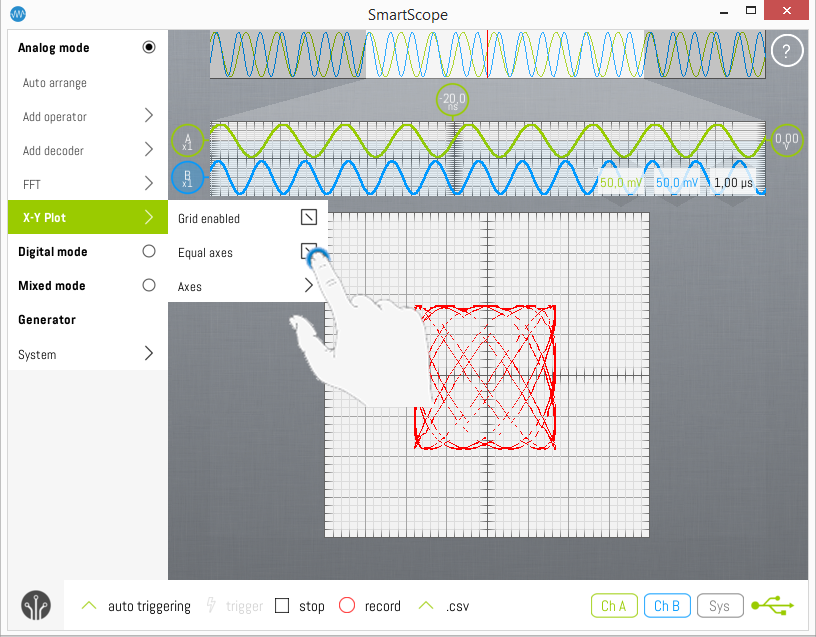
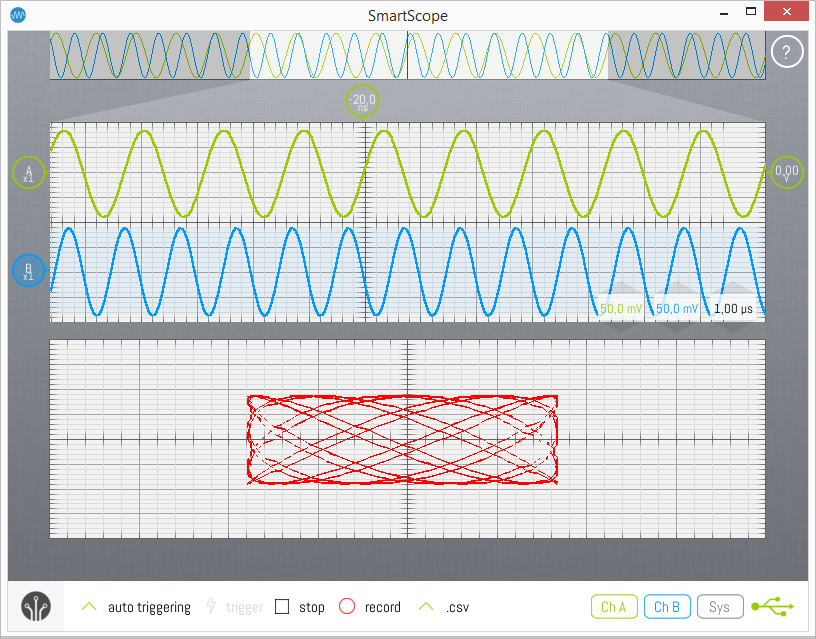
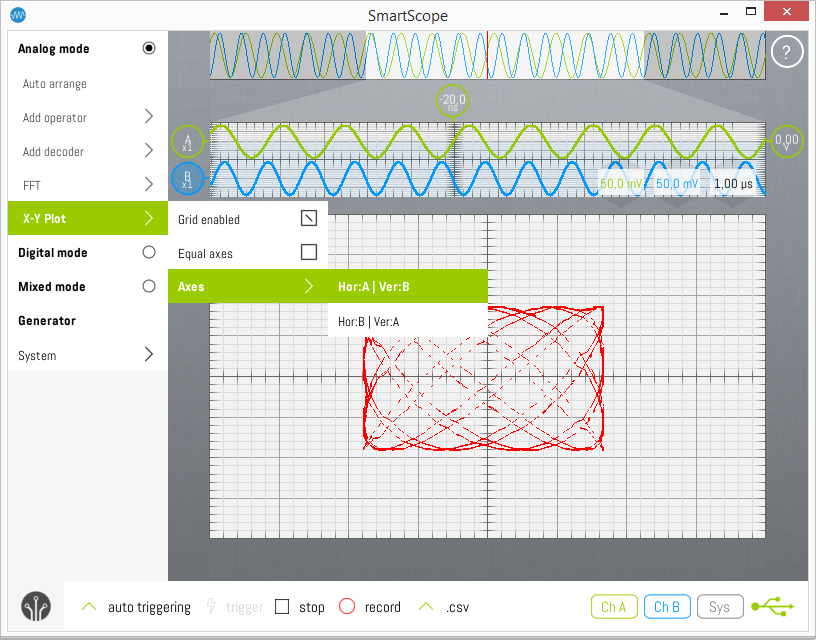
The SmartScope app comes with XY functionality, plotting Channel A versus Channel B (or vice versa)
Enabling XY mode
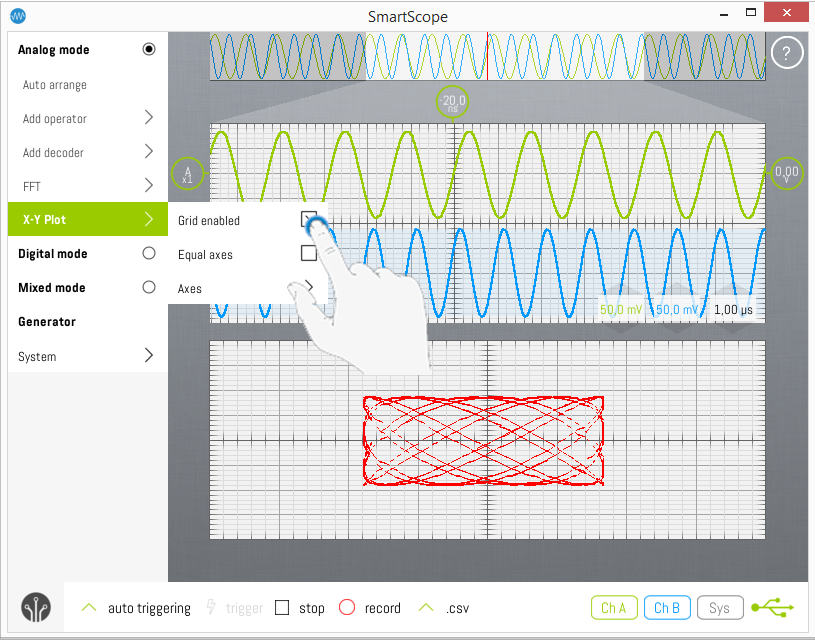
To enable XY mode, open the main menu and select Analog Mode -> XY Plot -> Grid enabled.
Enlarging the XY graph
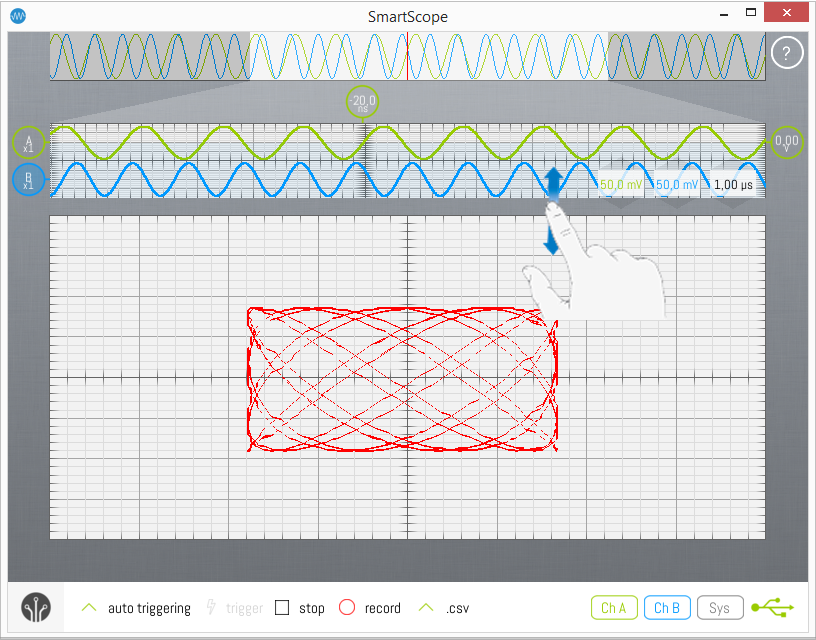
As with the FFT graph, you can freely select the size of the Analog graph and the XY graph. To do so, grab the gray horizontal border between both graphs, and drag it up or down.
Invert the axis
You can select to either
- plot Channel A versus Channel B
or
- plot Channel B versus Channel A
To select your preference, open the main menu and select Analog mode -> XY Plot -> Axes, and select your choice.
Squared XY graph
For some measurements, it is much preferred to have a squared XY plot instead of a rectangular one. To make the graph squared, open the main menu and check the Analog Mode -> XY Plot -> Equal axis checkbox.
