Controlling your SmartScope from Matlab
It is possible to configure all settings of the SmartScope from within Matlab, and to access all acquired data from within Matlab.
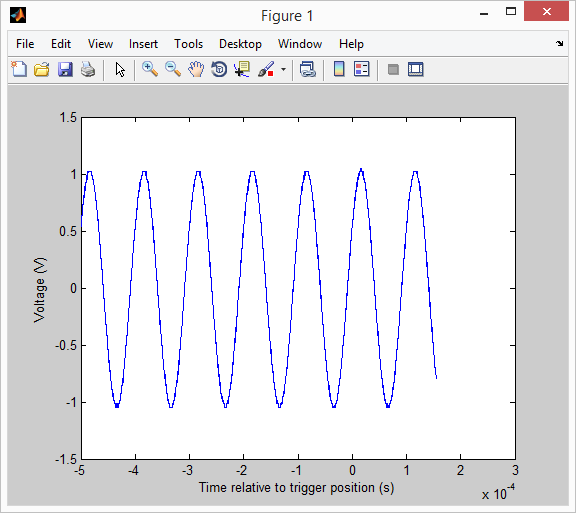
Data can be fetched and rendered to screen as shown below at 65fps on a regular laptop.

Prerequisites
Controlling the SmartScope from within Matlab will only work on Windows running MATLAB R2013 or later.
Download the Matlab scripts
Start by downloading the matlab repository from our Github pages. Either clone the repository, or click the ‘Download ZIP’ button to download all files without any hassle.
Running the scripts
This should give you two files:
- SmartScopeConnect.m: start by running this script, which will connect to, and configure the SmartScope.
- SmartScopePlot.m: contains basic code which fetches the latest data from the SmartScope and draws it on the screen
The files themselves also contain some explanation, which is listed below.
SmartScopeConnect.m
<syntaxhighlight lang="matlab"> %%%%%%%%%%%%%%%%%%%%%%%%%%%%%%%%%%%%%%%%%%%%%%%%%%%%%%% % SmartScopeConnect - Connects and initializes the SmartScope using Matlab % % Prerequisites: % - make sure the latest SmartScope software has been installed on this machine % - make sure the first line of code refers to the correct location of LabNation.DeviceInterface.dll % - make sure no other program is currently accessing the SmartScope % - make sure a SmartScope is attached to this machine % % Usage: % - just run the thing and you'll hear the SmartScope click hello % - now hook up a 10kHz signal to ChA % - run SmartScopePlot to see the results visualized in a graph % % Good to know: % - you can only link to the .NET assembly and scope once (Matlab limitation). Therefore, that code is enclosed inside the if clause below % % Tested on Matlab R2014a_64b+Windows8_64b </syntaxhighlight>
SmartScopePlot.m
<syntaxhighlight lang="matlab"> %%%%%%%%%%%%%%%%%%%%%%%%%%%%%%%%%%%%%%%%%%%%%%%%%%%%%%% % SmartScopePlot - Fetches a couple of data sequences from the SmartScope % and plots them in a graph. Also grabs some timing parameters. % % Prerequisites: % - make sure SmartScopeConnect was executed succesfully first % % Usage: % - just run this script % - if 5000 frames are too much, hit Ctrl+C % % Good to know: % - after running this script, type 'scope' % to see which parameters are exposed by the scope % - after running this script, type 'scope.DataSourceScope.LatestDataPackage' % to see which parameters are exposed by the most recently acquired % datapackage </syntaxhighlight>