High speed signals - Peak Detect Acquisition - Ecquivalent Time Sampling
The SmartScope was built for engineers on the road, engineers at home and students. For these use-cases, a digital wave of 10MHz was taken as target, requiring 100MS/s. Since this samplerate is rather low high compared to larger oscilloscopes, the SmartScope software contains a lot of functionality to optimize its performance when visualizing high-speed signals.
Peak-detect acquisition
What typically happens when zooming out on the timescale, is that the data is being subsampled. By subsampling, there’s a high chance tiny spikes would never be seen. The SmartScopes includes peak-detect acquisition, making sure that short pulses are still visible even when you're zoomed out a lot on the timescale.
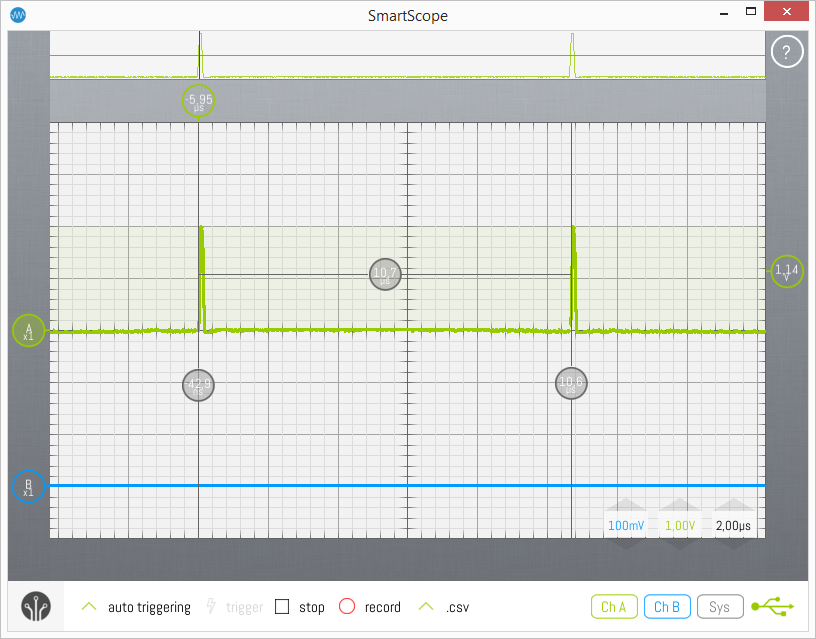
As an example: on the images below, 10 pulses of 10ns width are generated with 10us between them. This means there’s a 1% chance the pulse will be visualized. Since the SmartScope software renders 2048 pixels each acquisition, you’ll always see these pulses.

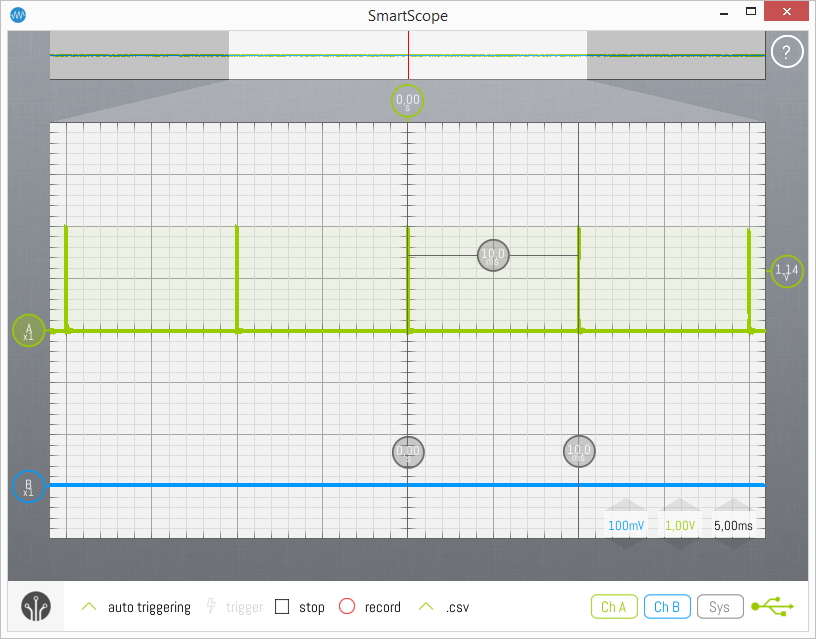
Now when the time between the pulses is enlarged to 10ms, there should be 0.001% chance of seeing the pulses. But because the SmartScope includes peak-detect mode acquisition, still each and every spike will be shown on the screen, as you can see in the image below

(notice that in the Panorama, which does not have peak-detect acquisition implemented, the pulses are indeed not visible)
Sin(x)/x triggering
Without sin(x)/x triggering, when zooming in on the timescale approaching 10ns/div, signals could appear jittery as the sampleperiod of the SmartScope is 10ns. The SmartScope software implements reverse sin(x)/x interpolation to predict the trigger-crossing, resulting in a steady triggering even of fast signals. This means you’re ensured each signal will be triggered on the exact crossing of the horizontal and vertical trigger indicators.
4GS/s Equivalent Time sampling
To top it off, the SmartScope includes functionality which oversamples the signal as you zoom in till 10ns/div. This means that periodic signals will be sampled multiple times, and the visualizer is showing the recombined waveform. As a result, on 10ns/div you'll see the waveform as if it were samples at 4GS/s. This obviously only works for periodic signals, which we're detecting automatically.
You'll see the ETS button at the top-left of the screen when it is activated. Tap it to disable ETS or to activate it again.
Note: in order for ETS to be available, the horizontal trigger position should be within the current timerange of the main graph. In other words: it should not be off-screen.
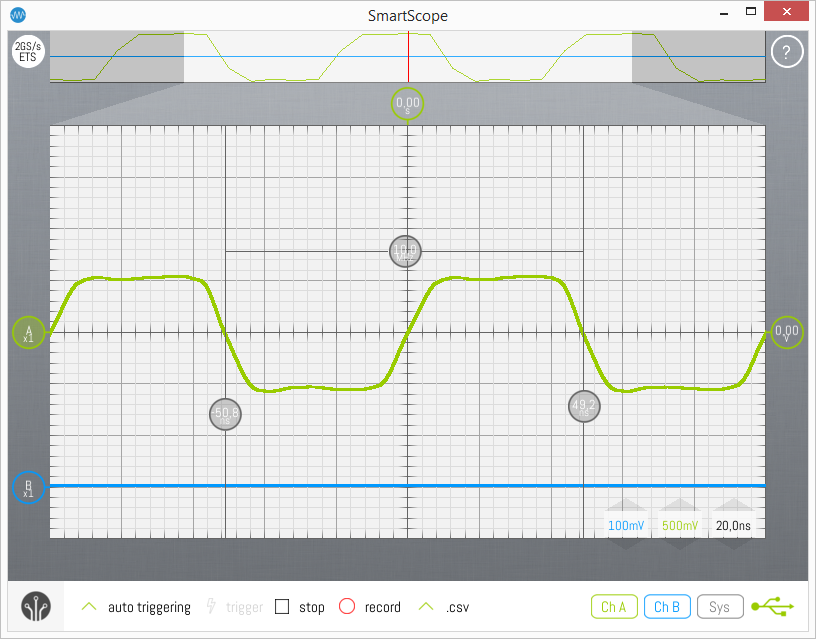
The image below shows how a 10MHz digital signal is visualized when ETS is activated:

(notice once more that the Panorama, which does not have ETS implemented, displays the 10MHz square as it would be displayed without ETS)