HowTo: Debugging and decoding your digital communication using the SmartScope as Logic Analyser
The rear port of the SmartScope allows you to hook up 8 digital probes. This article shows you how to use the SmartScope as Logic Analyzer to validate your digital circuits, and to automate the decoding of digital protocols for you.
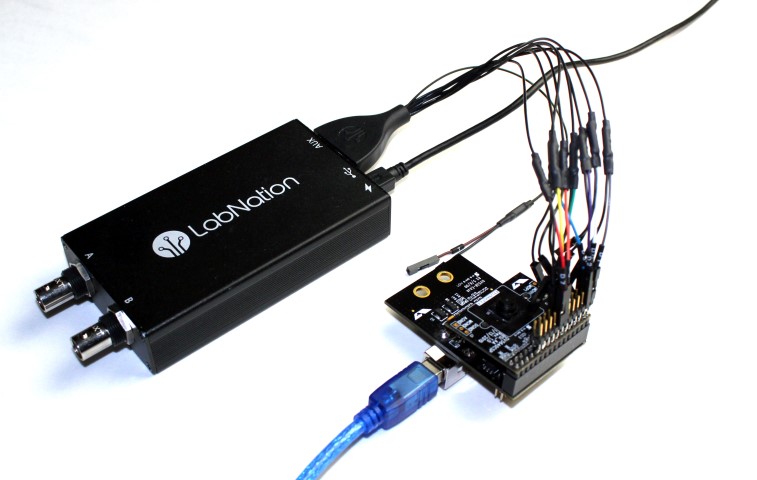
Logic analyzer concept
Most of today’s circuits have a digital section; either it’s a purely digital circuit or the digital core is used to control an analog circuit or to capture its outputs. When a digital circuit isn’t performing as it should, you want to see at which moments your digital lines are high and when they’re low; you want to see at which moments exactly they transition. The most basic usage of a logic analyzer is to study an event and its effect: attach 1 wire to the signal you want to monitor and a second wire to a trigger. Each time the trigger occurs, the logic analyzer captures the behavior of both signals during a certain timespan, allowing you to analyzer this at your own pace. For most cases, digital communication is all about multiple lines which need to respect a certain timing to each other. To this end, the SmartScope has 8 digital inputs and includes quite some functionality to measure the exact time between various transitions in your communication. And finally, logic analyzers are also used to monitor serial communication to pass messages between chips. Decoders help you to convert those streams of transitions into meaningful commands and values.
Key specifications
When looking at the SmartScope as a logic analyzer, there are quite a few specifications to be aware of.
Number of inputs
Even though 2 would be the bare minimum of inputs (to wait for a trigger and watch its effect on a signal), more is better in this case as this allows you to combine the bits of multiple inputs into numbers. Sometimes you’ll want to trigger on a number instead of a single signal. The SmartScope has 8 digital inputs on its rear port, on which you can either connect the 0.1” Dupont wires which ship with each SmartScope, or LabNation’s dedicated Logic Analyzer cable.
Input voltage range and protection
The Logic Analyzer stage of the SmartScope can capture digital ‘high’ levels between 1.8V and 5.0V. Newer chips typically use lower voltages, to reduce the power consumption and hence the EM radiation caused from charging and discharging the tracks and pins. Each input of the SmartScope contains protection diodes in both directions, making sure the circuitry will survive in case of unexpected behavior or voltage/ESD spikes. Just make sure you don’t apply a continuous voltage level above 5.5V.
Sampling rate
The SmartScope samples your signals at 100MS/s. This allows you to visualize pulses as short as 10ns. Translated to duty cycle, this allows you to measure the duty cycle of a 500kHz wave with a resolution of 1%.
Sample memory/RAM
Small sample memories (<10k) are sufficient if you want to visualize simple cause-and-effect situations. However, when you want to capture the communication between digital chips, you’ll want to have much more sample memory. For this reason, the SmartScope is equipped with on-board RAM which can capture 4M samples for each channel. This allows you to capture a complete transmission and then take your time to zoom in on any part of the transmission, decoding and verifying every edge of it. Which brings us to the next point…
Protocol decoders
Checking each and every edge of a digital communication can be very cumbersome and frustrating. While it is possible to manually translate short sequences, the counting of edges can soon turn into a headache.
To make this easier, the SmartScope software comes with built-in decoders for the most common protocols, including 1wire, UART/RS232, I2C, I2S and SPI. The decoder system of the SmartScope is very flexible, so decoders can also be built to display additional information such as the total number of edges, or the time between edges. You can even create your own decoder.
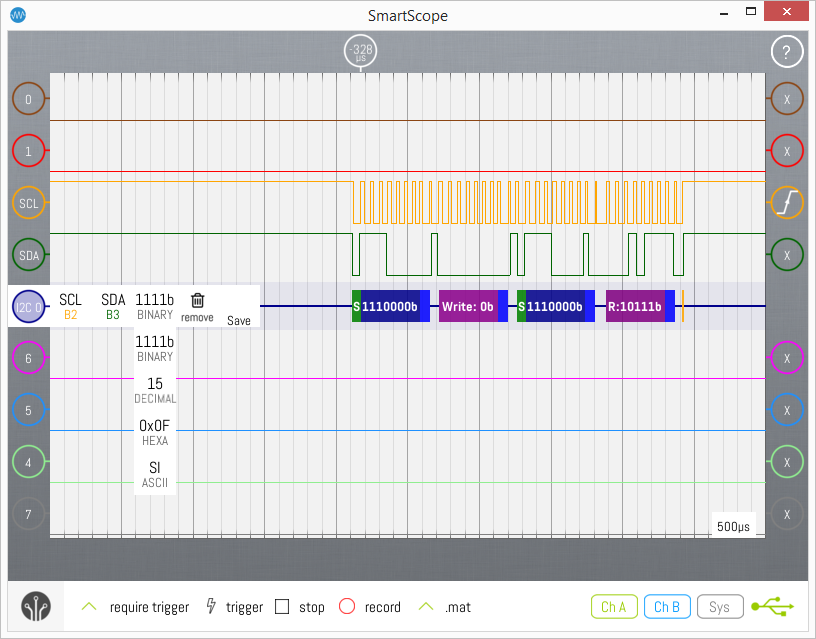
Figure 1: Protocol decoder at work
To be complete: on almost all USB-based logic analyzers, protocol decoding is done in software. This means that data is captured over a defined timespan, transferred to PC, and this section is decoded in software. Even though you can search through decoded data, there is no robust way to trigger on it. This would require the decoded data to be available in hardware, and the logic analyzers which do support this typically cost a multiple of a full SmartScope.
Getting started with the Logic Analyzer
This section explains how to get started using the Logic Analyzer of the SmartScope, and how to achieve the best results with it.
Connect properly to your hardware
As with an oscilloscope, a logic analyzer needs to have a reference of the 0V level on the device to measure. Therefore, you will need to make at least 1 connection between the ground of the SmartScope and the ground of the device you want to test. After that, connect the inputs of the SmartScope to the signals in your circuit of which you want to capture the data.
Set up the software
After connecting the SmartScope to your pc/tablet/phone, start up the SmartScope app and go to Menu -> Digital mode. By default, the 8 digital channels will be shown. In case you didn’t connect all channels and you want to free up some space, you can tap on the indicator of an unused channel and select ‘Hide’. The channel will be removed, and its indicator parked at the bottom-right side of the screen (see Figure 5). Simply tap it to restore that channel.
Configure the triggering
When you have connected the wires to a running circuit, you’ll probably see lots of signals coming through in a random fashion. By setting up a triggering condition, you can make the SmartScope wait for a certain combination of the digital signals to occur, before it is captured and displayed. This is achieved by changing the symbol inside the trigger indicator on the right of each signal. In Figure 1 for example, the SmartScope will wait for a rising edge to occur on D2.
The trigger position can also be adjusted to left or right, allowing you to focus on the part of interest. Note that the SmartScope has a very wide range for this trigger position, meaning you can very well set the trigger position outside the boundary of your screen, or even outside the boundary of your RAM. Notice that the trigger location inside the RAM is indicated by the red vertical line in the panorama at the top of the screen.
Finally, there’s the triggering mode. In ‘Require trigger’ mode, the SmartScope will wait for a trigger condition to happen and only then display the captured sequence on the screen. ‘Normal trigger’ mode behaves identically, but if no trigger condition was detected for 1 second, the SmartScope will simply capture sequences at will, and display them on the screen. ‘Single trigger’ mode waits for a trigger condition to occur, and then send that acquisition to the screen in its finest detail (so the entire RAM content is transferred at that time).
Accessing basic information
With an acquisition frozen on screen, there is a lot of information you can immediately access, as shown in the image below:
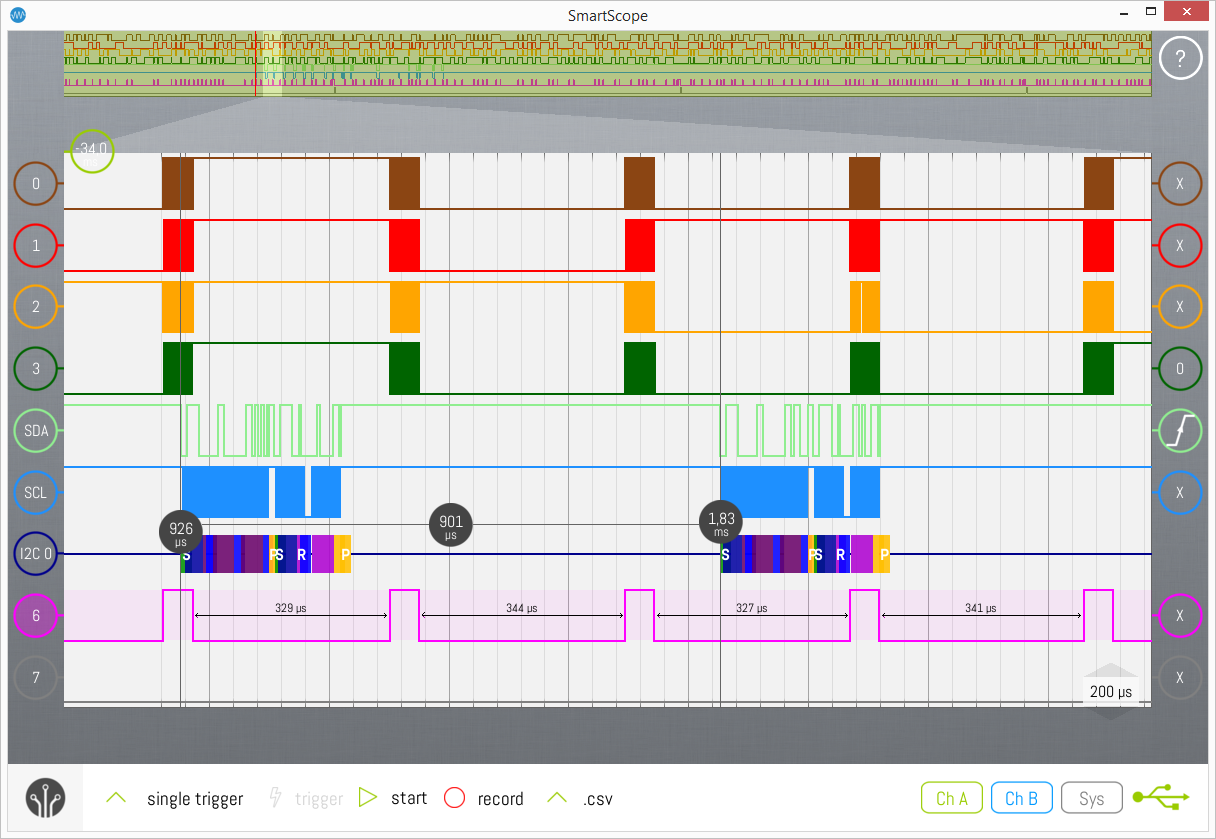
Figure 2: Interface to a 5MP RGB image sensor. The bottom lines are the HSync and VSync, the top 4 lines contain actual pixel data. D4 and D5 are the Data and Clock lines of the I2C channel, with a decoder added to decode their data.
Interval timing
For the currently selected wave, the time interval between all edges is displayed. Hover your mouse over any way to display its interval information as well.
Time cursors
Drag in a time cursor from the side of the graph onto the graph. By adding a second cursor, a delta-cursor will appear which displays the timespan between both cursors. When you tap that delta-cursor, the timespan will be replaced by the corresponding frequency.
Edge decoders
In case you need to know the exact number of edges displayed between 2 location, go to Menu -> Add decoder -> Edge counter. Select the channel you’re interested in, and the decoder will count the edges for you. Adding the ‘Edge intervals’ decoder instead will show you the time between each interval, down to 10ns accuracy.
Using the digital decoders
In a lot of systems, digital chips communicate with each other over a low-speed channel to pass on configuration data and/or low-speed measurement data.
Such a channel is also present in the image above, where the controller is passing a message towards the RGB imager using the I2C protocol. Each protocol is well-defined; in case of I2C the message starts with a byte containing the address of the target chip and whether the master wants to read or write to it. Each bit of the SDA line should be interpreted at the moment there’s a rising edge on the SCL line.
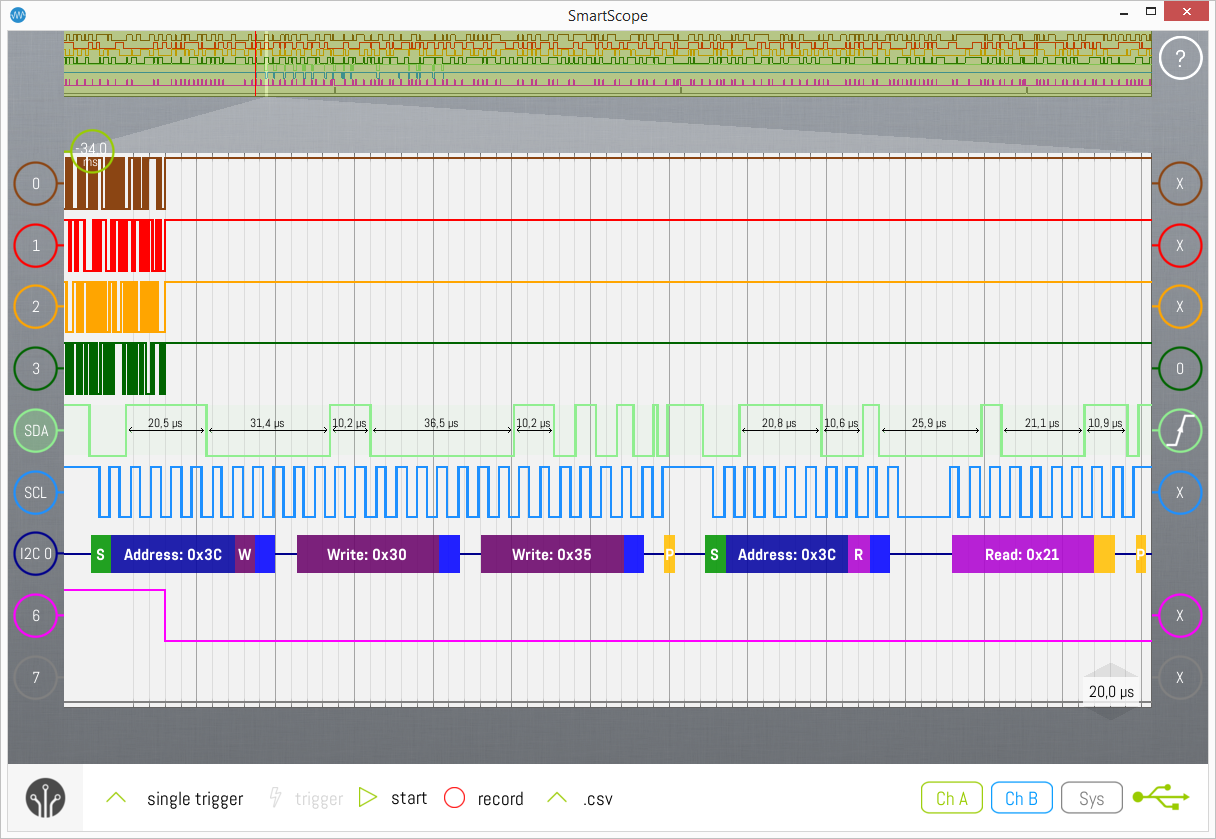
Figure 3: Decoded I2C message
Based on this information, you can start off decoding the data you see on the screen, noting down the value of the SDA line at each rising edge of the SCL line. Or you can ask the SmartScope app to do this job for you: simply go to Menu -> Add decoder -> I2C Decoder. The decoder will be added to the screen, and the software contains some smarts which try to detect which wire is SDA and which is SCL. The image above is a more complicated situation with multiple lines connected at low and high frequencies, so we need to give the software a hand. With the decoder menu opened by default, hit the SCL button and select D4. Next, hit the SDA button and select D5. Finally hit the indicator itself to remove the menu, and you should see that the decoder managed to decode the entire communication for you.
Changing the radix of the decoder
Sometimes you’ll want to know the decoded values as simple decimal numbers, but sometimes you’ll need them as hexadecimal values. This you can specify by tapping on the indicator of the decoder, tapping on the radix button and then selecting the type of output you want (see Figure 1). This way you can translate your UART communication straight to ASCII, for example.
Creating your own decoder
The decoder subsytem of the SmartScope app is very flexible. You can even code your own decoder in C#, compile it and place it in the same folder as the app [1]. This allows you to create a decoder for your own protocol, or you can even stack decoders. By stacking them, you can for example create a decoder which takes the output of the I2C decoder and translates the register addresses to register names.
Achieving optimal results
Signal integrity
It might take some fiddling with the wires to get correct measurements, especially on signals with high-frequency signals which are actively driven low and high. Because the wires between the SmartScope and the device you want to measure are unshielded, crosstalk between the wires can occur. As such, a rising edge on one wire might cause a very short pulse on a neighboring wire. Since both electrical and magnetical influences exist, when using unshielded wires the best approach is to use short wires, and to separate them but keep them close to a ground wire.
Additionally, the Dupont wires act as a small capacitance which you add to the signal you’re monitoring, which can influence the signal itself up to a point that communication starts failing, just because you’ve hooked the wire to the signal.
LabNation Logic Analyzer cable assembly
Because of the aforementioned reasons, LabNation provides a dedicated Logic Analyzer cable to connect to the AUX port on the rear side of the SmartScope. For each digital input, the cable provides shielding by using a grounded coaxial wire. At the side of the signal to measure, each coax is split up into a short wire for the signal itself, and another wire for a possible ground connection, allowing for optimal shielding. Additionally, a small filter circuit is implemented on the tiny PCB where the coax is split up into the 2 wires, reducing the influence of the cable on the signal itself to a bare minimal.
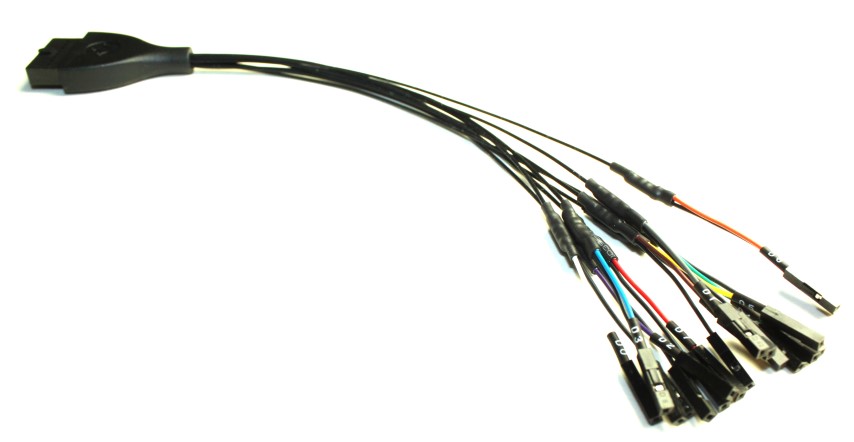
Figure 4: LabNation’s Logic Analyzer cable
As extra benefit to a customized cable, each wire includes a marking ‘D0’ to ‘D7’ and has the same color as the wave in the SmartScope app. This makes it much easier to attach your cables to the pins on a board.
Decoding strategy
Practical applications where a Logical Analyzer shines most, is where you want to capture a lengthy communication, decode this and save the result to file. Here you can find the easiest way to do this.
Start off with a decent connection between the SmartScope and the device to test. Preferably using the Logic Analyzer cable, or by making sure signal wires are separated and ground is closest to the highest-frequency wire. Make sure there’s a perfect ground connection between both boards.
Set the triggering condition: typically a rising or falling edge on one of the signals. Make sure signals that don’t matter for the trigger are set to ‘X’, or the trigger condition might never occur.
Next, arrange your Panorama (the RAM view at the top of the screen) such that it can fit the full communication you want to analyze. Typically you’ll want to move the trigger position (the vertical red line) to the far left of the panorama. If available, the most optimal way to do this is by running the scope in Auto triggering mode and generating a couple of sample communications.
Finally, select Single trigger mode and wait for the next communication. As soon as the trigger fires, the full contents of the RAM will be transferred to your host, allowing you to browse through it at your own pace, and add decoders as you see fit.
If you need such a long Panorama that your sample rate is becoming slower than 100MS/s, go to Menu -> System -> Acquisition depth -> 4MS. This allows you to use the full depth of the RAM, which will obviously take longer to transfer to your host.
Mixed mode to the rescue!
In some cases you might see perfect signals on your screen, but your chips are not reacting to it. It could be that your communication is using 3.3V logic, while your chip is expecting 5V signals. This would give perfect signals in the logic analyzer, but it would be invisible to the 5V chip. Or the other way around, where everything works fine but you see unexpected spikes in your logic analyzer.
This is the time where you want to have both a logic analyzer AND an oscilloscope. And that’s exactly what the SmartScope is. Go to Menu -> Mixed mode, which gives you one analog channel in addition to the full Logic Analyzer.
Both analog and digital channels are measured synchronous in time, so when you attach your analog probe to one of the digital probes you can see both the analog shape of the signal and the digital result as shown in the image below. Notice that the portion shown in the large graph is less than 1% of the data contained in the RAM, providing plenty of detail for both the analog and digital waveforms.