Oscilloscope functionality: Difference between revisions
mNo edit summary |
|||
| Line 3: | Line 3: | ||
=Selecting the Oscilloscope mode= | =Selecting the Oscilloscope mode= | ||
By default, upon startup the SmartScope app will be in Oscilloscope mode. Whenever you are in a different mode, and want to return to the oscilloscope mode, simply select it at the top of the [[main menu]]:<br> | By default, upon startup the SmartScope app will be in Oscilloscope mode. Whenever you are in a different mode, and want to return to the oscilloscope mode, simply select it at the top of the [[main menu]]:<br> | ||
[[File:SelectOscilloscope.png | [[File:SelectOscilloscope.png]] | ||
=Oscilloscope main screen= | =Oscilloscope main screen= | ||
The key parts of the main screen are shown on the image below. This image can be used as reference for the rest of this text.<br> | The key parts of the main screen are shown on the image below. This image can be used as reference for the rest of this text.<br> | ||
Revision as of 13:59, 9 November 2015
One of the main features of the SmartScope is its dual channel 100MS/s oscilloscope functionality. Where a logic analyzer allows you only to detect whether a positive signal is above or below a certain voltage, an oscilloscope will give you the actual voltage for every sample. This section describes how to operate the SmartScope software to effectively use the oscilloscope functionality.
Selecting the Oscilloscope mode
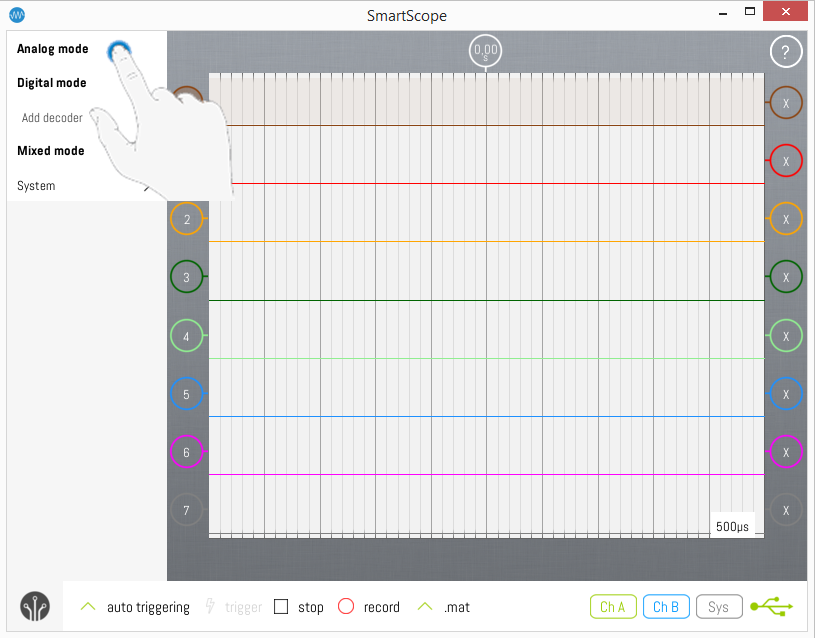
By default, upon startup the SmartScope app will be in Oscilloscope mode. Whenever you are in a different mode, and want to return to the oscilloscope mode, simply select it at the top of the main menu:
Oscilloscope main screen
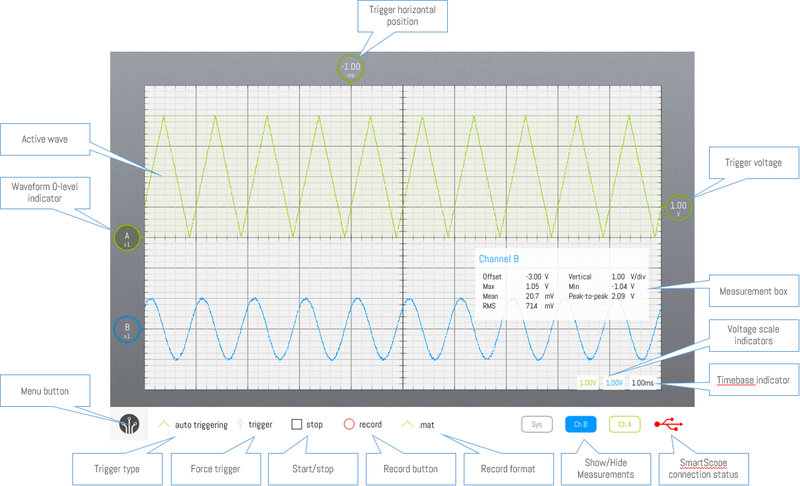
The key parts of the main screen are shown on the image below. This image can be used as reference for the rest of this text.
Visualizing the signal
When applying a signal to the inputs of the oscilloscope connectors, you will want the signal to be displayed nicely on the screen. Since the oscilloscope has pretty large input range, this will involve some scaling and panning depending on the signal. Usually, this involves zooming out both in voltage (vertically) and on the timebase (horizontally) until you’re happy with the size of the signal, and then panning the wave to the area where you want it to be.
Selecting the active wave
Scaling and panning only affect the ‘active wave’ (the signal currently selected). You can easily see which wave is currently highlighted, as:
- Its background is slightly highlighted
- Its 0-level indicator has a darker color
Changing active wave can be done in the following ways
| Touch | Mouse | Keyboard |
|---|---|---|
| Tap | Click | (Shift+) Tab |
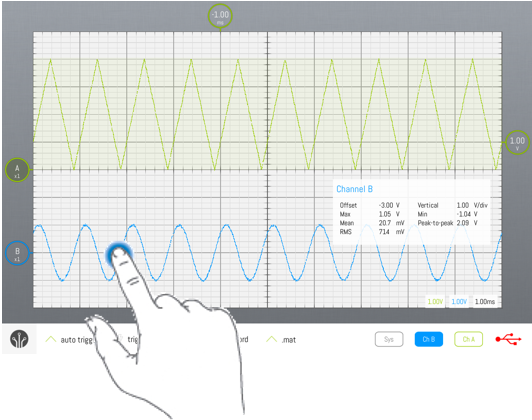
See the image below on how to select the blue wave as active wave:
Alternative ways where the active wave will be selected automatically:
- When you start draggin (by touch or mouse) a non-active wave, it becomes active
- When you start pinching a non-active wave, it becomes active
Voltage scaling
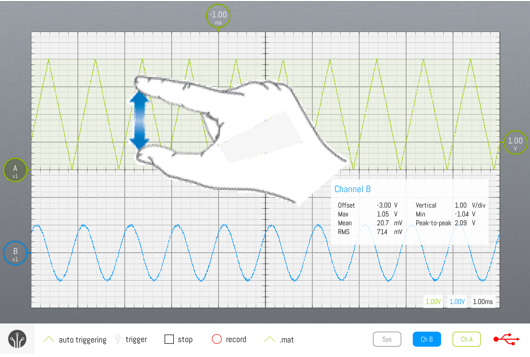
Zooming in or out the voltage scale of the active wave is done through the following operations:
| Touch | Mouse | Keyboard |
|---|---|---|
| Vertical Pinch | Right-drag | PgUp or PgDown |
The grid in the background can help you determine the voltage level or amplitude of your signal. The grid is split in 10 divisions, and the voltage of each division is displayed in the Voltage division indicators, on the bottom-right of the screen. Notice that each signal can have a different scaling factor, and such there is one indicator for each wave.
The image below shows how voltage zooming on the green wave can be done:
Timebase scaling
Depending on whether you want to visualize a fast signal or a slow signal, you’ll want to set the timebase accordingly. This can be achieved using the following operations:
| Touch | Mouse | Keyboard |
|---|---|---|
| Horizontal Pinch | Mousewheel or right-drag | Home or End |
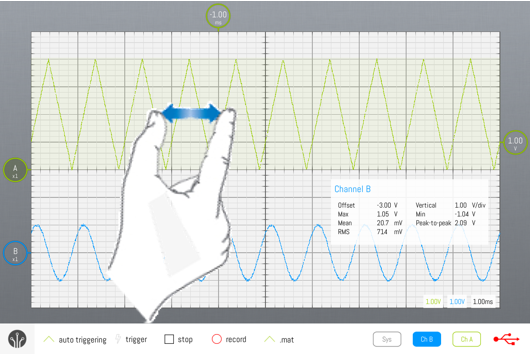
The grid can help you determine the timebase of your signal as well. The grid is split in 10 horizontal divisions, and the timespan of each division is displayed in the Timebase indicators, on the bottom-right of the screen. Notice that each signal can have a different scaling factor, and such there is one indicator for each wave.
The image below shows how timebase zooming on the green wave can be done:
Panning
While zooming allows you to fit the signal on the screen, you’ll also want to position it to your liking. Here are the operations to achieve this:
| Touch | Mouse | Keyboard |
|---|---|---|
| Drag | Left-drag | Arrow keys |
Using touch/mouse, you can drag either the wave (notice the faintly colored background behind the wave: this indicates the sensitive area!), its 0-level indicator or the horizontal trigger indicator. Dragging the indicator has the benefit that they auto-snap to the grid divisions.
Dragging will also occur when, while pinching, you move both fingers in the same direction.
0-panning
When using touch, you’ll often want to set the timebase or voltage offset to 0. This can be done accurately in these ways:
- By double-tapping the 0-level indicator, or double-tapping the horizontal trigger indicator
- By dragging the indicators, they will auto-snap to all grid divisions, including the 0-levels
AC and DC coupling
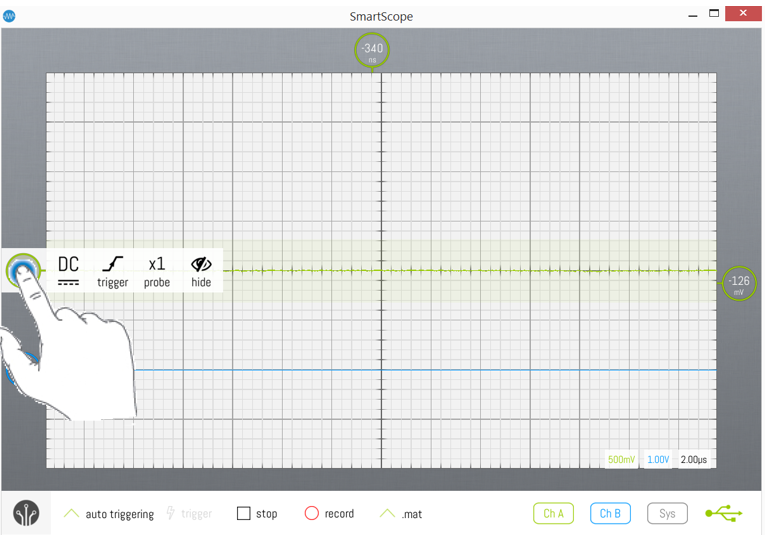
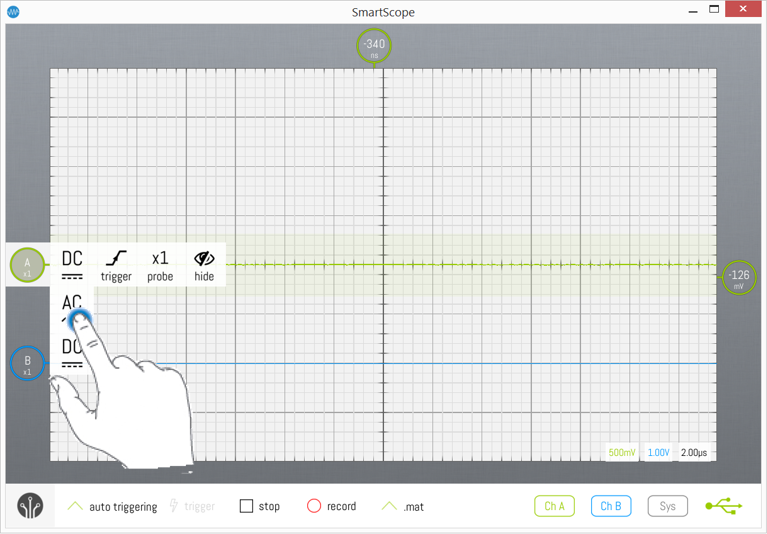
By default, each analog channel is set to DC coupling. This means that the voltages displayed will be the true, absolute voltages. Eg: a wave between 0V and 5V will be displayed as a wave between 0V and 5V. Alternatively, you can choose the set a channel to AC coupling. Doing so will cause the wave to be displayed, centered around 0V. Eg: the same wave between 0V and 5V will be displayed between -2.5V and 2.5V. This mode is quite often useful, eg in case you want to visualize a transient signal of low amplitude superposed on a large voltage. Eg: a 0.1V noise wave on top of a 12V power supply.
You can switch between DC and AC coupling, simply by clicking/tapping the wave indicator, and selecting the desired coupling mode. This is shown in the images below:
Triggering
Triggering is useful for two reasons:
- In case of repetitive signals: triggering will align all captured waveforms before displaying them
- In case of sporadic signals: the SmartScope will wait until an edge was detected, and then display that capture. Otherwise, the SmartScope would be capturing patches of data at random, and there would be a chance you would miss the section of interest.
For now, the SmartScope supports rising and falling edge triggering. A rising edge is detected whenever the input signal transitions from below the trigger voltage to above the trigger voltage. This trigger voltage can be set as well.
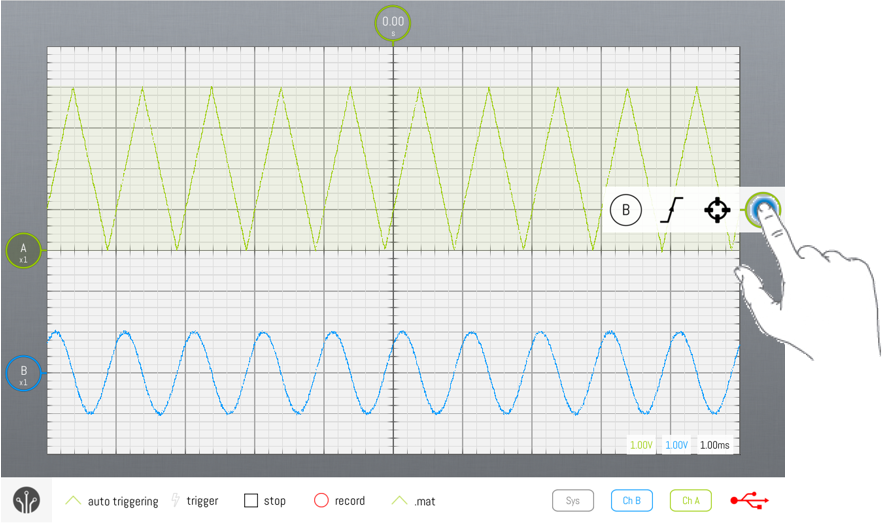
All trigger settings can be set through the Trigger context menu, invoked by tapping on the Trigger voltage indicator or Trigger timebase indicator, as shown below:
Changing trigger channel
You can specify which channel to trigger on, by opening the Trigger context menu as shown above, and tapping on the leftmost item. In the image above, tapping on the B would make channel B the trigger channel. Changing trigger channel can also be done by hitting the T key when a keyboard is available.
Changing between rising and falling edge
You can specify which channel to trigger on, by opening the Trigger context menu as shown above, and tapping on the second leftmost item. A small drop-down menu will be shown, allowing you to specify whether on which edge you want to trigger. This is shown in the image below.
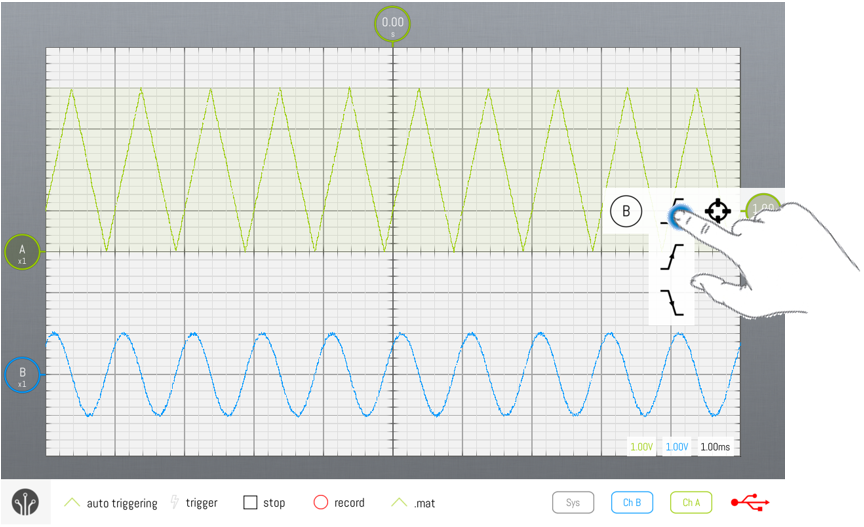
Changing the trigger voltage
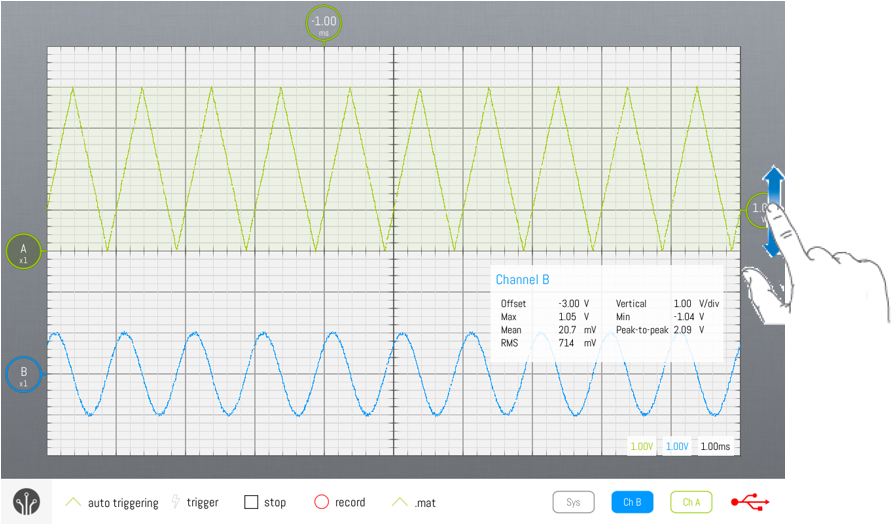
The trigger voltage level can be changed intuitively by scrolling the Trigger level indicator on the right of the screen up or down, as shown in the image below. Notice the effect of triggering: the signal will cross the trigger level at the intersection of the Trigger voltage indicator and the Trigger timebase indicator.
Changing the type of triggering
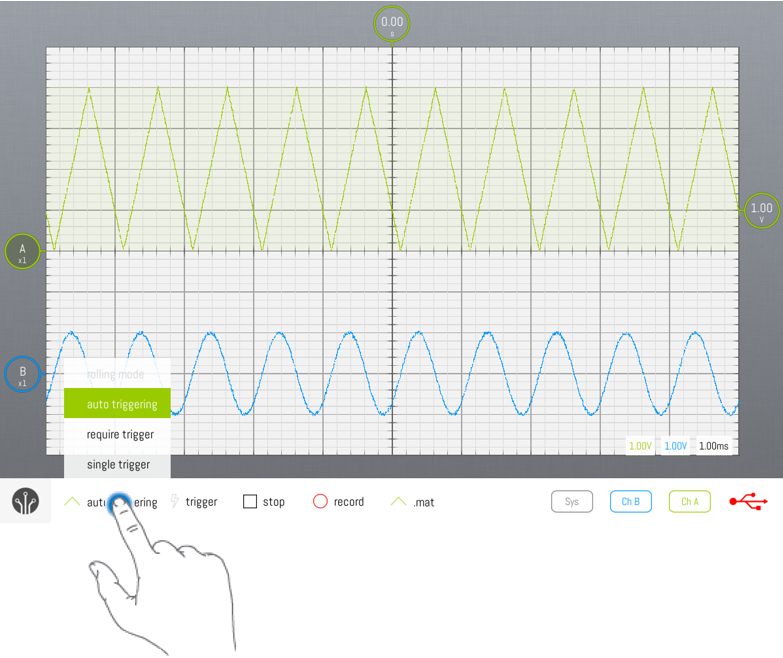
By default, the SmartScope will start using Auto triggering mode, and will switch to Rolling mode whenever you zoom the timebase beyond 20ms/div, to visualize slow signals. However, you can freely select the trigger mode of your choice by tapping on the Trigger type drop-up list, as shown below.
Notice that the ‘Rolling mode’ is only available when you’re visualizing slow signals (20ms/div and up).
Auto mode
In Auto mode, every time a trigger is detected, the waveform is acquired, transferred to the host and visualized. Whenever the trigger is lost (eg: when the input signal is removed, or when the signal changes so no more crossings with the trigger level occur), the SmartScope sends any acquired waveform to the host for visualization
Normal mode
In Normal mode, every time a trigger is detected, the waveform is acquired, transferred to the host and visualized, much like Auto mode. However, in case no trigger is detected, no new data is transferred nor visualized, keeping the last triggered waveform on the screen.
Single mode
Single mode puts the SmartScope in waiting mode until a trigger is detected. In such case, the waveform is acquired and visualized, after which the SmartScope puts itself in Stopped mode. Single mode is useful in case you want to visualize the very first occurrence of a trigger, or in case you want to capture a unique event and don’t want to remove the result in case of some glitch occurs when you remove the probe.
Rolling mode
When you’re visualizing slow signals, you end up with timebase settings like 100ms/div. With 10 divisions, this means it takes 1 seconds before an acquitisition can be made, so you only get screen refreshes every second. In such case, it is usually preferred to visualize the data as a continuously incoming stream of data, as you get realtime updates of the signal and you can stop the SmartScope whenever you want.
Cursors
See the main page on Cursors to find out all details about them.
Measurements
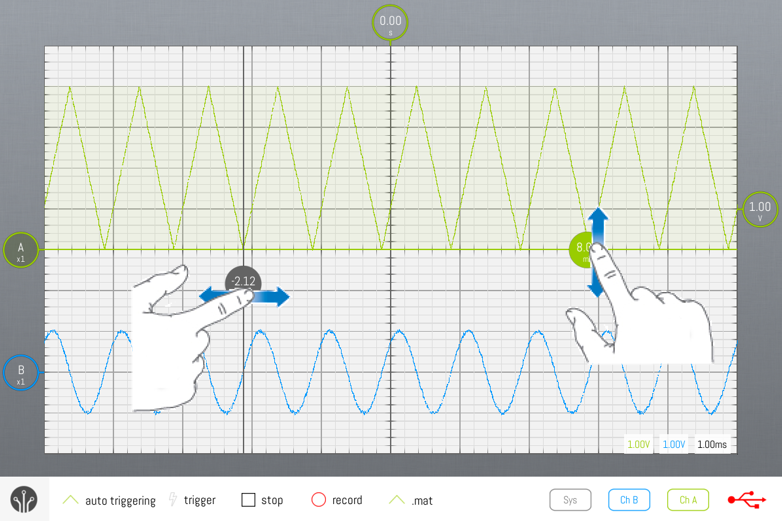
For now, the SmartScope software contains a basic set of measurements. This number of measurements will grow, and together with it, the way of dealing with measurements will change. Measurements can relate to a channel (eg amplitude or mean voltage) or to the system (eg update rate). Measurement boxes can be shown or hidden by tapping on their corresponding button in the bottom-right corner. They can also be removed by dragging them out of the grid area.